PV power plant performance challenges from hilly area and complex terrain
As the demand for renewable energy spreads across the U.S., solar PV plant construction is underway in regions where hilly topography and near shading present challenges. A flat, treeless PV project is relatively straightforward to simulate in a solar performance model, but hilly topography and improperly calculated near shading can account for as much as a 5 to 10 percent decrease in annual energy performance. Developers must properly address project near shading and topographic losses now or face an increased risk of project underperformance and loss of revenue.
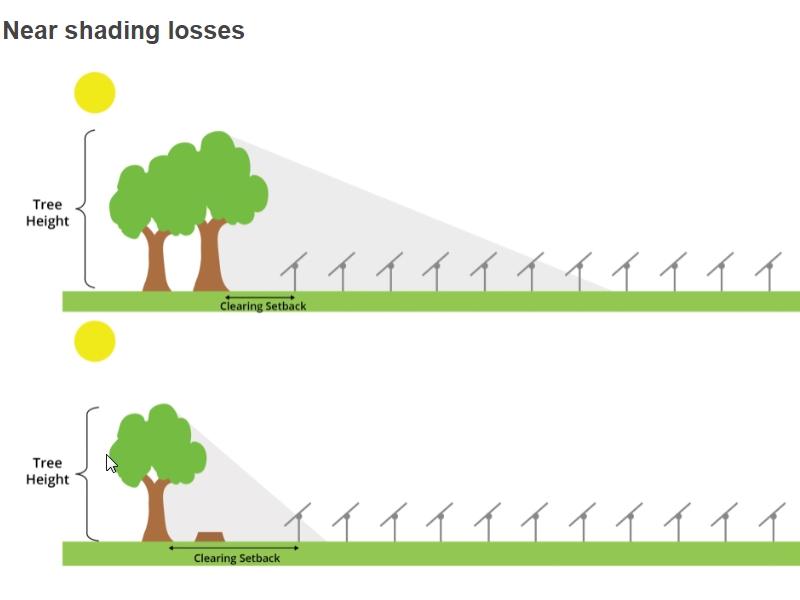
![]() Fig 1: Example of PV plant near shading losses showing a short clearing setback (top) and a wider clearing setback (bottom). Tree heights are also important to consider when accurately modeling near shading impacts on performance.
Fig 1: Example of PV plant near shading losses showing a short clearing setback (top) and a wider clearing setback (bottom). Tree heights are also important to consider when accurately modeling near shading impacts on performance.
Land parcels in regions with significant tree cover are often targeted for solar development due to lower cost and easier access to the power grid. Shading associated with vegetation and tree cover near a PV project can significantly reduce energy production over time. Figure 1 illustrates the conceptual impact of near shading from trees on a PV project.
The clearing setback distance and height of the nearby trees dictate the amount of shading loss a PV project will incur. Increasing the clearing setback distance from the edge of the PV array to the nearest tree line will reduce the amount of shading loss but must be weighed against additional tree clearing costs and any environmental limitations (e.g., wetland setback restrictions, endangered species considerations, carbon footprint analysis, etc.).
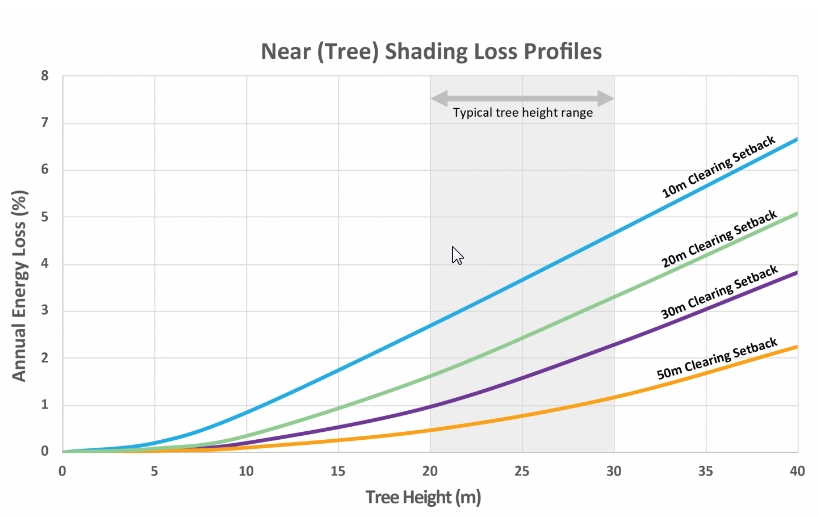
Fig. 2: Illustration of near (tree) shading losses from an equal east, west and south shaded PV project with varying tree heights and 10-, 20-, 30- and 50-m clearing setbacks.
Figure 2 quantifies the expected near shading loss as a function of tree height for various clearing setback considerations for a hypothetical PV project located in the Southeastern U.S. The results shown are from a simplified 50-MWac square PV project with equal east, west and south side shading profiles. The diffuse fraction of solar irradiance (i.e., the ratio of diffuse irradiance to global horizontal irradiance or GHI) is 0.4 at this location. Sunnier regions can expect higher near shading losses while cloudier regions can expect lower losses.
Typical tree heights are in the 20- to 30-meter range, which can have widely varying shading losses depending on the clearing setback distance. As expected, the closer the trees are to the PV modules, the more impactful the tree shading loss is with increasing tree height. Inaccurate tree heights and clearing setback distances rapidly propagate through energy production estimates due to their continuous impact during times of the day and the year when inverter and point of interconnect limit clipping are at a minimum.
Land-use restrictions and environmental requirements limit wetland clearing setbacks in most locations. Having accurate tree heights and setback distances within the site shading scene in the base energy model is critical to help dial in an accurate performance estimate for the developer.
Topographic losses
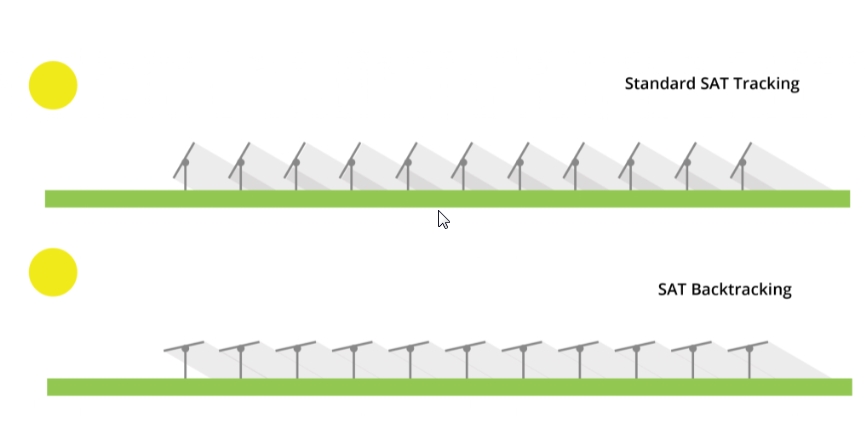
Fig. 3: Example of SAT standard tracking (top) and backtracking table configurations for a late afternoon solar profile. Row-on-row shading is eliminated with SAT backtracking.
Balancing site civil grading needs with performance impacts becomes more challenging as the site becomes worse and worse. Choosing to limit grading to less desirable slope limits can lead to significant savings associated with site civil work but will incur a cost to project performance. Properly quantifying the slope loss for a PV project will help a developer optimize performance.
The typical single-axis tracker (SAT) PV installation will utilize backtracking algorithms to eliminate any row-on-row shading that might occur at a site. An illustration of SAT standard tracking and backtracking configurations is shown in Figure 3. The SAT backtracking algorithm is driven by the distance (pitch) between SAT rows and the SAT collector width.
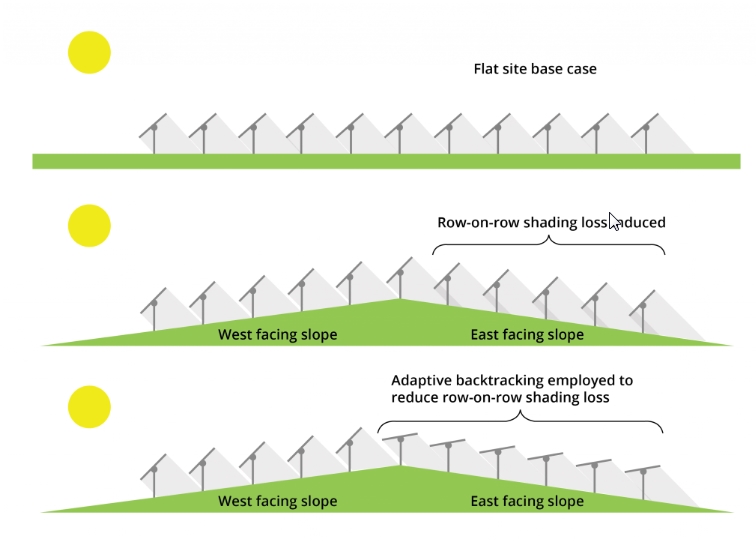
![]() Figure 4: Illustrated PV plant east/west slope induced shading losses for a flat base case (top), sloped case with standard backtracking (middle) and adaptive backtracking (bottom).
Figure 4: Illustrated PV plant east/west slope induced shading losses for a flat base case (top), sloped case with standard backtracking (middle) and adaptive backtracking (bottom).
On a flat site (top), SAT backtracking implementation is straightforward and easily deployed. However, the flat site SAT backtracking algorithm quickly breaks down when the terrain becomes uneven in the east and west directions. Figure 4 (middle) shows how row-on-row shading is induced on an east-facing slope during the afternoon if changes in SAT table elevations are not accounted for in the backtracking algorithm.
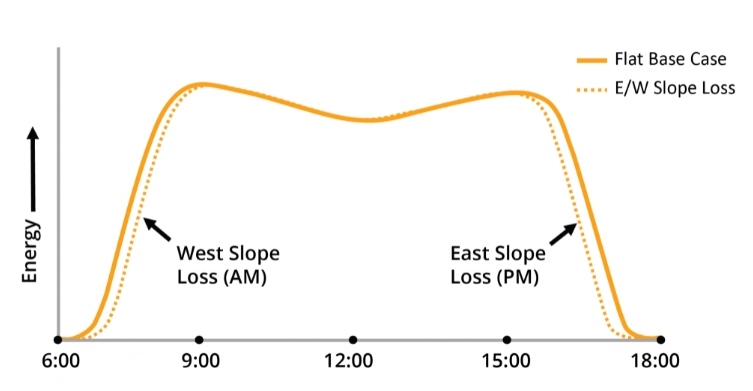
Figure 5: Example of diurnal PV plant energy profiles from a flat base case (solid) and with applied east and west slope loss impacts (dashed line).
A similar shading loss would also occur in the morning on west-facing sloped SAT racks leading to a recurring loss in energy in the early a.m. and late p.m. times of the day (Figure 5). From a project performance perspective, a flat earth assumption will always lead to an overestimation of energy when east and west slopes are present.
The good news is that there is a way to reduce the east and west slope losses shown in Figures 4 (middle) and 5. This involves the implementation of what is known as adaptive backtracking and is illustrated in Figure 4 (bottom). By incorporating SAT table elevation details into the SAT backtracking algorithm, one can greatly reduce the amount of east and west slope loss due to row-on-row shading. Although the result of adaptive backtracking is a lower angle of incidence of solar module orientation, it still results in more energy production than when row-on-row shading occurs on east/west-facing slopes.
Nearly all SAT racking manufacturers offer various forms of adaptive backtracking that can be implemented during project construction and commissioning to help mitigate much of the east/west slope-induced energy losses. This reduction in east/west slope loss varies between roughly 60 to 90 percent and is dependent on the SAT racking choice, the magnitude and variability of east/west slopes present at the project site.
Modeling challenges
Both near shading and east/west slope loss challenges begin with their incorporation into the PV project’s base energy model. The solar industry typically relies on performance modeling software such as PVsyst as the source of a project’s base energy model. Near shading impacts from tree heights and clearing setbacks can be dialed in within the 3D shading scene within PVsyst. Although time consuming to set up within in PVsyst, an accurately modeled near shading scene will pay dividends later in the form of improved performance estimates.
Analyzing slope loss impacts in PVsyst is a more challenging endeavor. Within PVsyst, simple, uniform north and south-facing slopes can be modeled but not east/west-facing slopes and their respective losses associated with SAT PV projects. Proposed project layouts need to be evaluated for east/west slope details, and then are typically analyzed using a combination of iterative PVsyst model runs and post-processing applications to quantify east/west slope losses. With competent slope loss modeling, the expected east/west loss recovery that SAT adaptive backtracking can bring can be appropriately applied to the project performance.
Case study
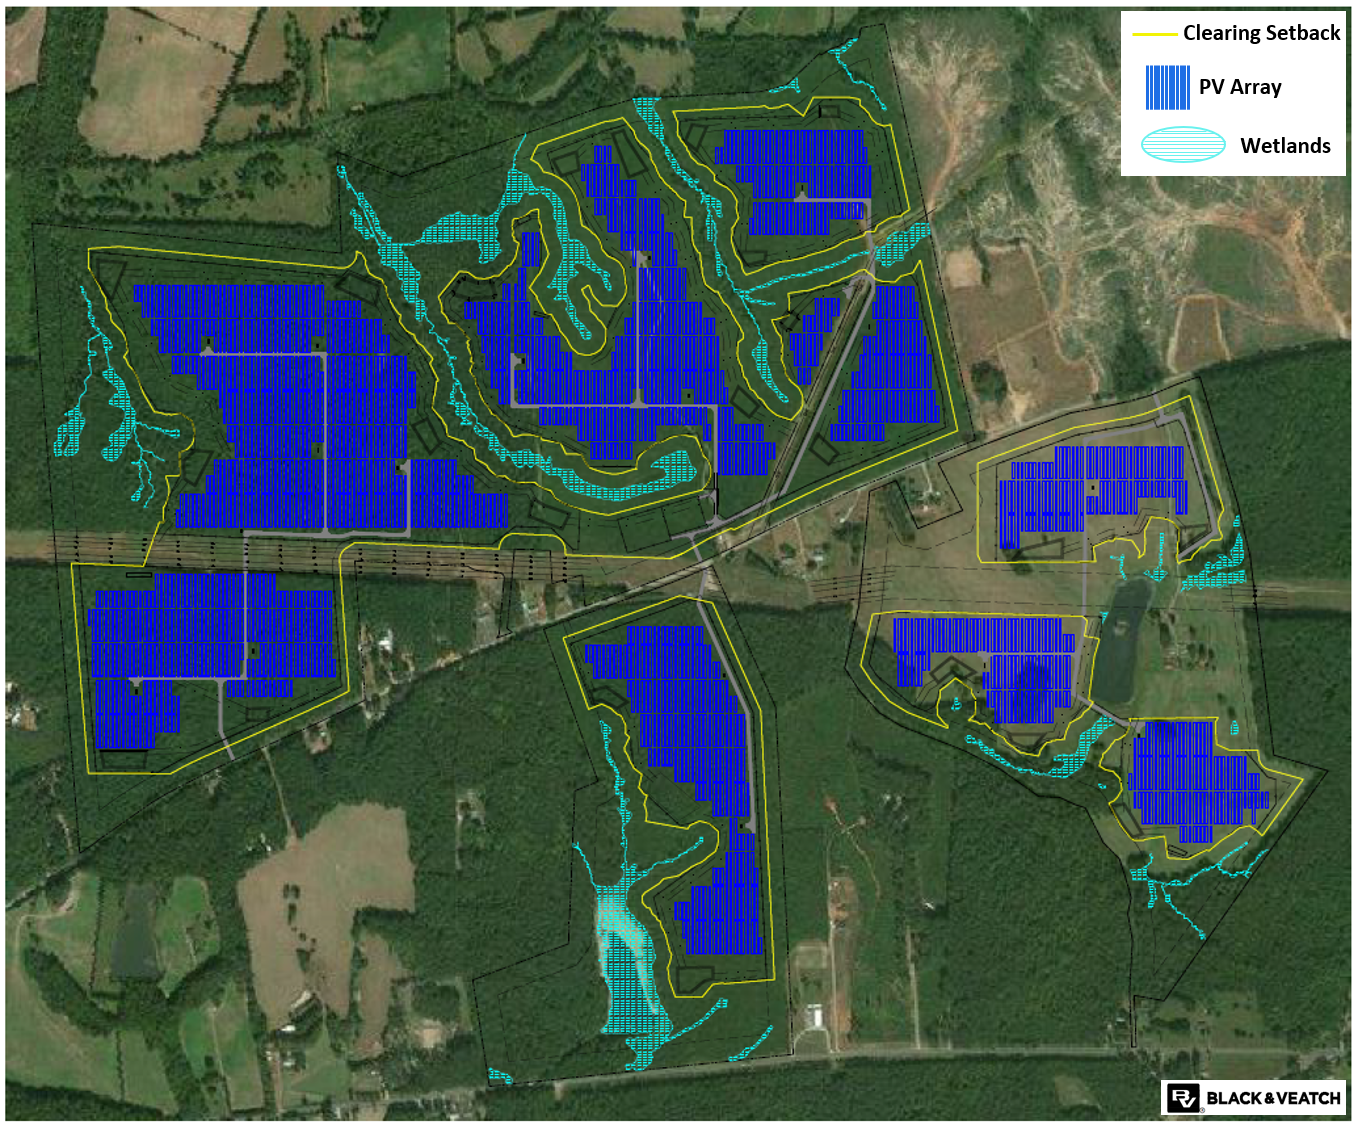
Figure 6: Eastern U.S. PV project layout with extensive near shading (tree) and topographic variance across the site.
Figure 6 shows an example of a PV site layout that illustrates the impact of near shading and complex terrain. This layout is based on a PV project proposal currently being evaluated for development. The site is crisscrossed with wetlands and tree clearing setbacks vary widely across the layout. Various permitting and environmental restrictions whittled away the buildable area within the project leading to a significant drop in expected performance.
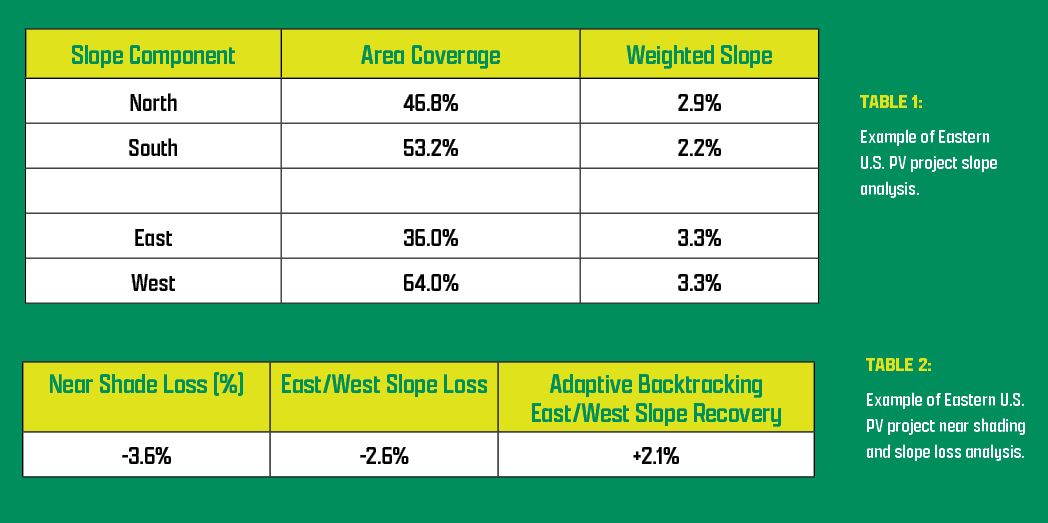
Table 1 lists the results of the site topographic slope analysis. The PV project has about the same weighted average east/west slope percentages but has a 2:1 ratio of west-to-east slope coverage. North and south site slopes nearly offset each other equally. The site’s near shading and east/west slope losses are reported in Table 2.
There is a significant near shading loss of -3.6 percent expected at this site based on the current site layout and clearing setbacks. The east/west slope loss is predicted to be -2.6 percent with an expected SAT adaptive backtracking recovery of 80 percent here resulting in a net east/west slope loss of -0.5 percent.
Discussion
Near shading and complex terrain challenges are becoming more common as PV projects are developed on less desirable sites. These two major considerations challenge current PV performance modeling tools and make it even harder for solar developers to dial in performance. The bottom line is that there are more and more underperforming solar projects out there. This is due to the push in the industry to develop and sell financially viable projects. After being built, there is little recourse available to rectify PV projects that are missing their performance metrics. Engaging a competent independent engineering firm during the design and construction phase of a PV project is the best way to mitigate additional performance risks associated with near shading and east/west slope loss.

